Monitoring and Graphing with Etekcity VeSync
In my prior post I mentioned that I purchased the HoneyComb LX2K hoping to take advantage of ARM’s lower power usage for a home server. I wanted to know exactly how much power it was using, so I went looking for a smart plug with an API.
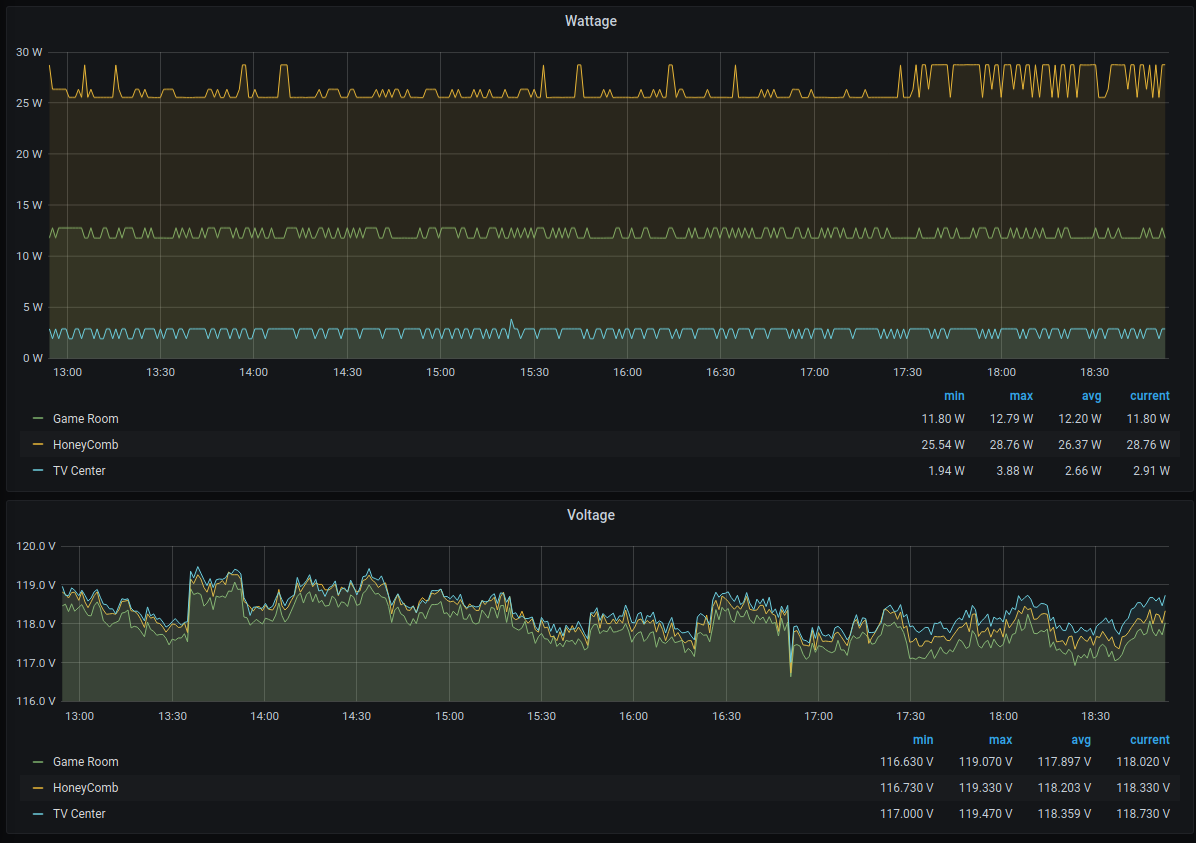
The Etekcity VeSync smart outlets don’t have a public API, but I found the pyvesync project on github where some nice fellow reverse engineered it and made a Python module. Came to find that my new server is using about 25 watts when it’s not doing much, 29 if my backup drive is plugged in, and around 45 if it’s maxed out. The ability to turn the outlet on and off also makes it possible for me to hard reset it remotely, and I have the console plugged into my VPN server, so it’s like a crappy IPMI.
This got me curious, so I bought two more for the different media centers in my apartment. One is the main TV with the FireTV and PS4 hooked up to it in the living room. When streaming video on the PS4, that gets up to about 180 watts. In my office I have an old CRT television with a bunch of vintage consoles. With everything off, the DC adapters for the consoles are collectively consuming 13 watts all the time. I just like knowing this stuff.
So of course I have to graph it now. My toolkit here is pyvesync, InfluxDB and Grafana. The small service I wrote using all this only took about 70 lines of code. The source code is available here.
Hopefully if Etekcity sees people doing this, they make the API public instead of shutting the door on it.
