Collecting Cloudflare Logs with GraphQL
I recently migrated my website from Ghost to a static one using Jekyll. There is some peace of mind knowing I don’t have all those moving parts or a login page for people to try exploiting. However, part of my morning routine was to look at Grafana and start snitching. I’m not even kidding, I’d find particularly aggressive IP addresses in my Nginx logs and start filing reports. Now that my website is serverless and I don’t have logs or metrics on it, how do I entertain myself?
Well, “serverless” doesn’t mean entirely secure, so I wanted to keep monitoring it, mainly a plain blackbox check to make sure my expected front page is up, and log insight into any attempts to flood the thing.
I put Cloudflare in front of my site and had some access to things through their dashboards. It’ll typically only show you 100 entries though. I use Grafana Loki for log storage and saw their collector Promtail had Cloudflare support! …for Cloudflare Enterprise plans. Not even the Pro plan will work here, it has to be enterprise, and we’re not doing that for a hobby blog.
After some digging around in their documentation, I found out they have a GraphQL endpoint available for their free tier. From here, you can still get security analytics including HTTP access logs. Would it work for an enterprise workload? Ha, they’d 429 you within seconds. Hobby tech blog? You can absolutely scrape everything from this.
With a little less than 100 lines of Python code, I had this shipping my access logs to Loki. I’d never worked with GraphQL before and it appears to be a pretty robust framework. I spent a couple hours with the documentation on it and haven’t really scratched the surface, but I managed. I had to dig deep into a dump of Cloudflare’s schema and then start split half troubleshooting which items I was and was not allowed to collect on. What was left to me was:
datetime
cacheStatus
clientASNDescription
clientAsn
clientCountryName
clientDeviceType
clientIP
clientRequestHTTPHost
clientRequestHTTPMethodName
clientRequestHTTPProtocol
clientRequestPath
clientRequestQuery
clientRequestScheme
clientSSLProtocol
edgeResponseStatus
leakedCredentialCheckResult
originResponseDurationMs
requestSource
securityAction
securitySource
userAgent
That’s not bad! I get some things I didn’t get from my old Nginx logs like the ASN, but unfortunately I wasn’t permitted clientRequestReferer and a few other things I wanted.
There’s a Python client for this called gql. I spun up a venv and installed it with pip. If you’re working with a different programming language and are just following this for ideas, check the list of client libraries on the doc site.
If I’m correct (you can contact me if I’m wrong), live streaming through websockets wasn’t an option with Cloudflare’s implementation. It also doesn’t update as fast as you’d like, being about 3 minutes behind. This left my initial timestamp based approach with a lot of holes in the data. Ultimately, I found Loki would happily reject the exact same log line from the exact same nanosecond, so I had no problems just setting it to push the last 15 minutes every run. This way I’m able to run it on a systemd timer every 60 seconds. If you want some extra safety, set it to 5 minutes, because if you did get rate limited by Cloudflare, that’s how long you sit in the penalty box. The limit: 3000 in our query though should be in a safe range.
Here’s a rough example that would work on a cron. Adapt it into a service if you want. You can also apply this logic to any of the other GraphQL endpoints Cloudflare offers.
from gql import gql, Client
from gql.transport.aiohttp import AIOHTTPTransport
from datetime import datetime, timezone, timedelta
import requests, json

cloudflare_headers = {
    "Authorization": "Bearer your-token-here",
    "X-Auth-Email": "your account email here",
}

loki_headers = {
    "Content-Type": "application/json",
}

transport = AIOHTTPTransport(
    url="https://api.cloudflare.com/client/v4/graphql",
    headers=cloudflare_headers
)
client = Client(transport=transport, fetch_schema_from_transport=False)

# loki will deduplicate, but GraphQL won't update right away,
# so look at the last 15 minutes of logs on every run.
fifteen = datetime.now(timezone.utc) - timedelta(minutes=15)

query = gql(
    f"""
        {{
            viewer {{
                zones(filter: {{ zoneTag: "your-cloudflare-zone-id" }}) {{
                    httpRequestsAdaptive(
                        filter: {{
                            datetime_gt: "{fifteen.isoformat()}"
                        }}
                        limit: 3000
                    )
                    {{
                        datetime
                        cacheStatus
                        clientASNDescription
                        clientAsn
                        clientCountryName
                        clientDeviceType
                        clientIP
                        clientRequestHTTPHost
                        clientRequestHTTPMethodName
                        clientRequestHTTPProtocol
                        clientRequestPath
                        clientRequestQuery
                        clientRequestScheme
                        clientSSLProtocol
                        edgeResponseStatus
                        leakedCredentialCheckResult
                        originResponseDurationMs
                        requestSource
                        securityAction
                        securitySource
                        userAgent
                    }}
                }}
            }}
        }}
    """
)

result = client.execute(query)

values = []
# Only one zone was queried
for entry in result["viewer"]["zones"][0]["httpRequestsAdaptive"]:
    # On Python 3.12 I just had to use fromisoformat() and call it day.
    # On 3.11 I had to go back, explicitly add a 0 UTC offset and parse it.
    # ts = int(datetime.fromisoformat(entry.pop('datetime')).timestamp() * 10**9)
    add_timezone = f"{entry.pop('datetime')} +0000"
    ts = int(
        datetime.strptime(add_timezone, "%Y-%m-%dT%H:%M:%SZ %z").timestamp()
        * 10**9
    )
    # Let's format it to logfmt, which is human readable
    # and can be parsed by Loki.
    logstr = ""
    for k, v in entry.items():
        logstr += f'{k}="{str(v)}" '
    values.append([str(ts), logstr.strip()])

payload = {
    "streams": [
        {
            "stream": {
                "zone": "yourdomain.name",
                "level": "info",
                "service_name": "cloudflare",
            },
            "values": values,
        }
    ]
}

r = requests.post(
    "http://127.0.0.1:3100/loki/api/v1/push",
    data=json.dumps(payload),
    headers=loki_headers
)
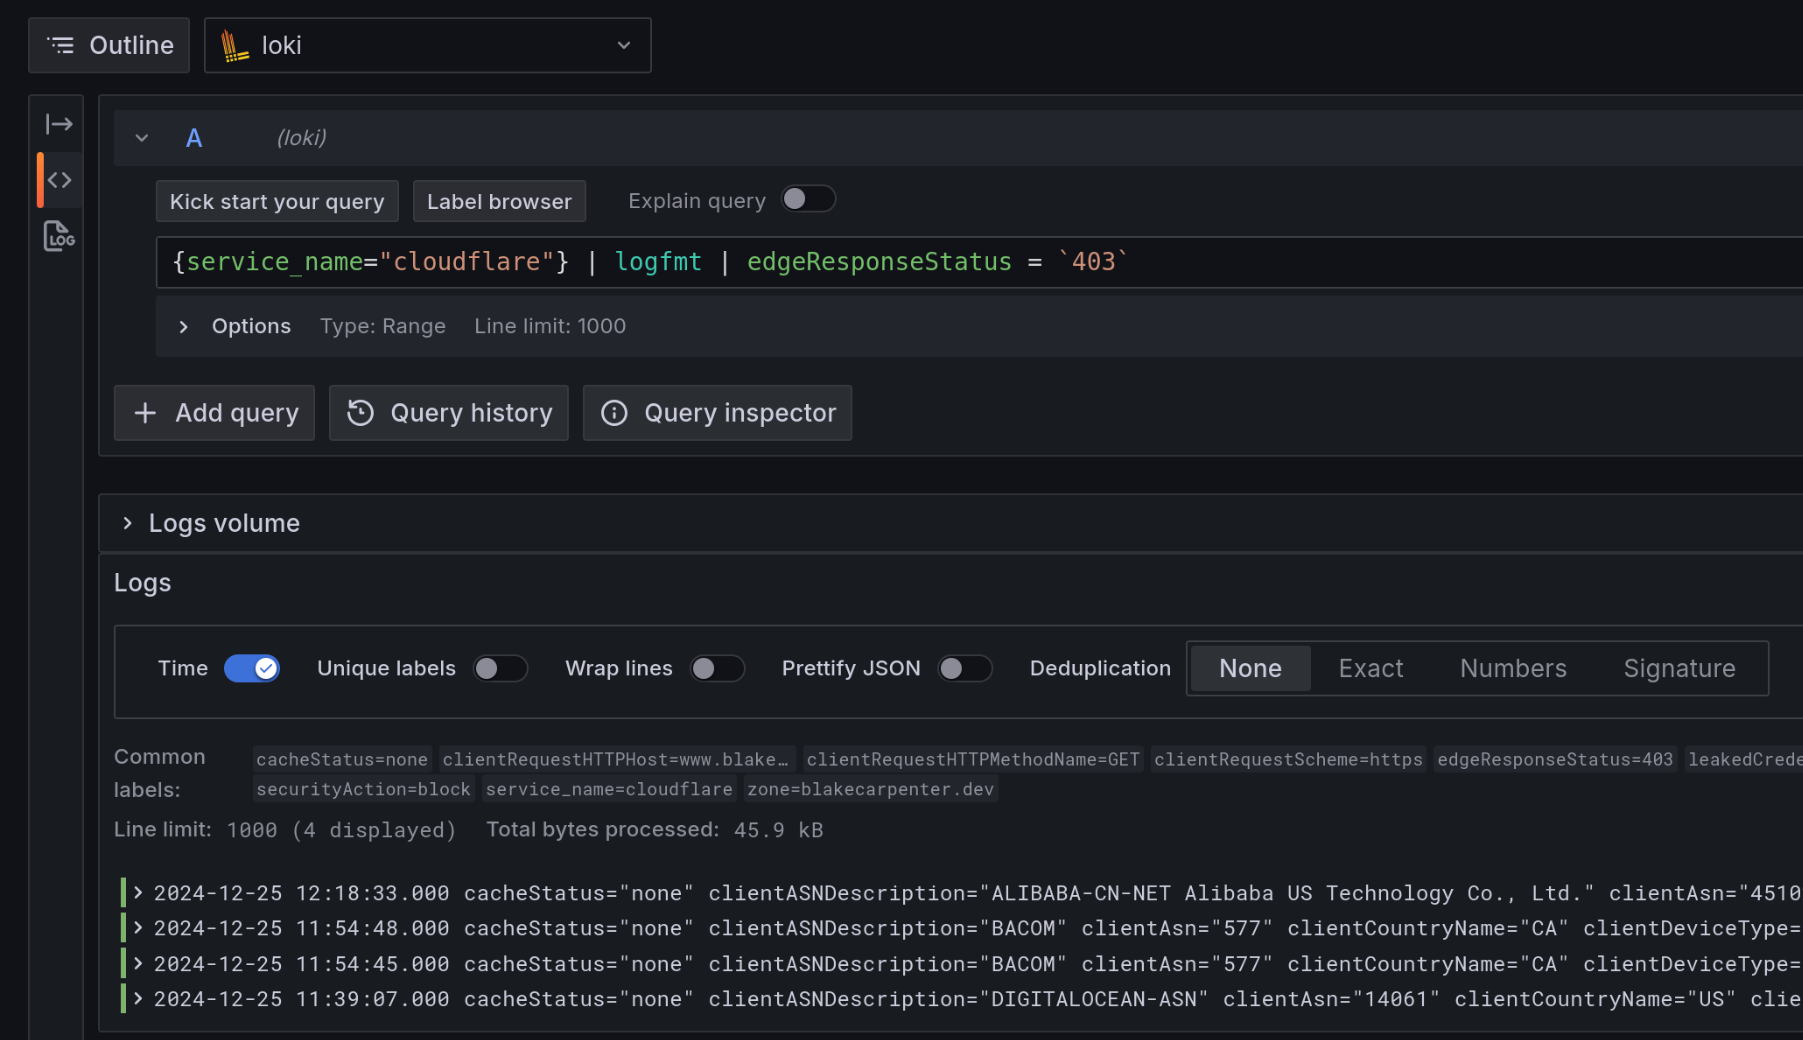
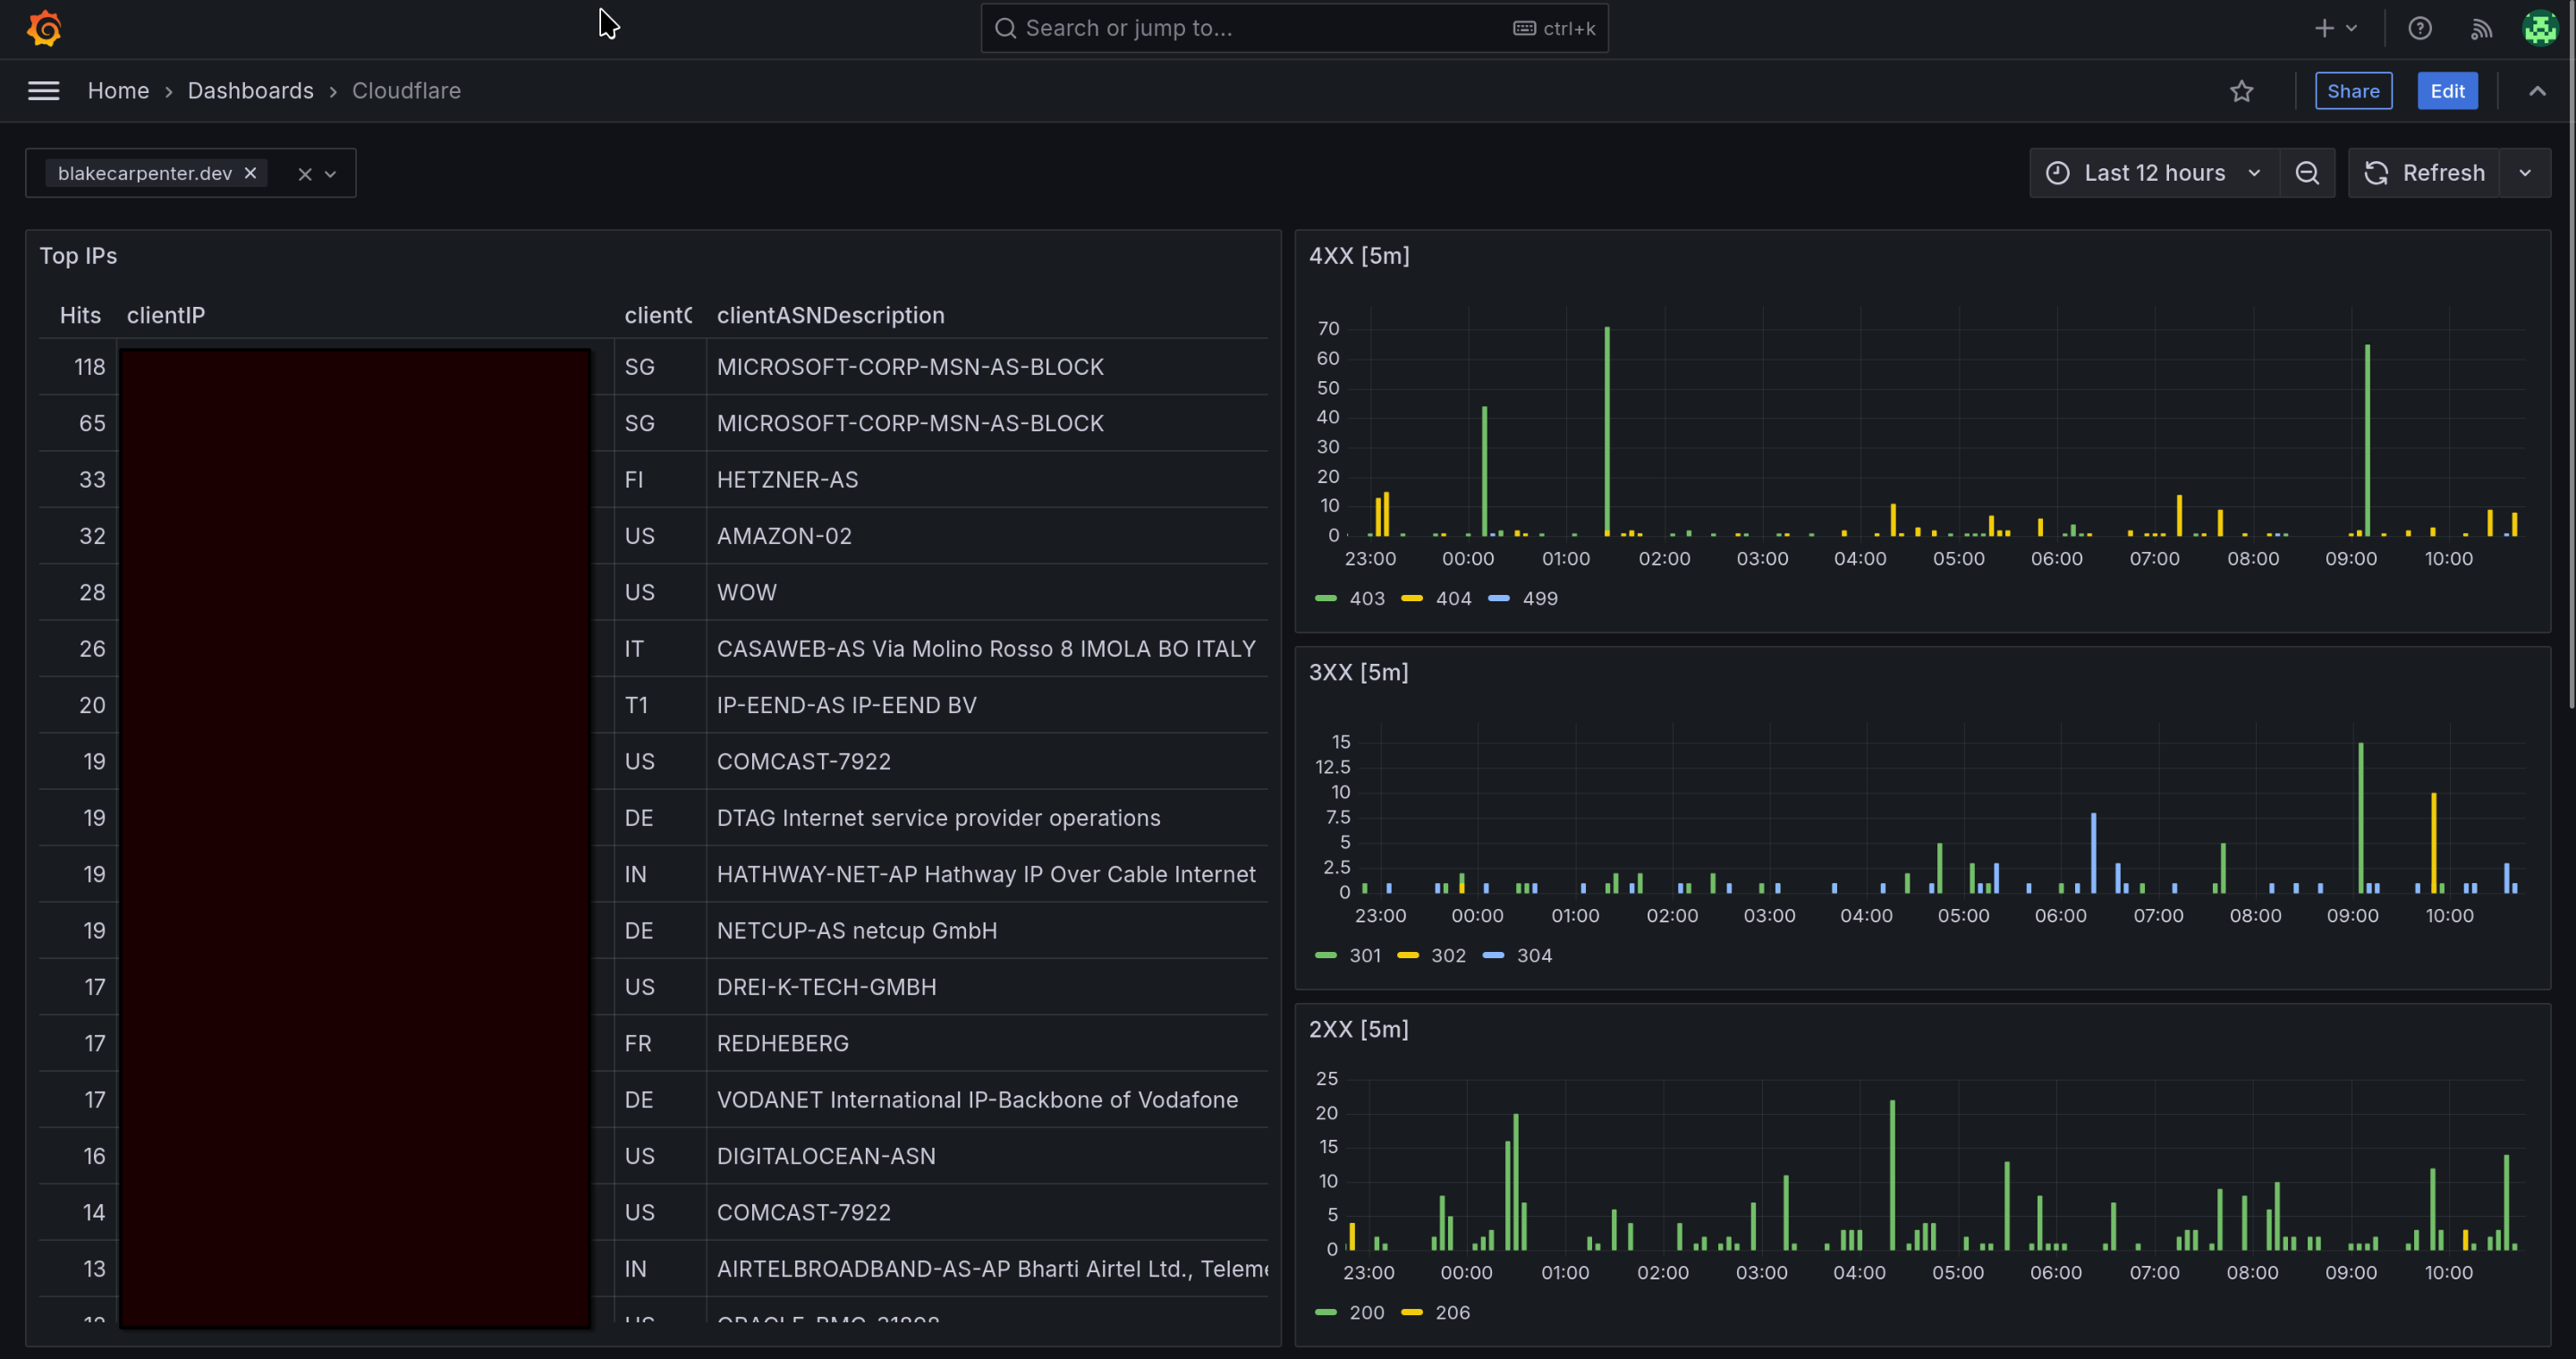
Fire up Grafana and have a look.

This isn’t the most complete example, but it works! It is Christmas, so I’m bored at home and decided to crank something out really quick. Subscribe for more poorly reviewed, hastily written content.
